Visualize Stress and Cracks Remotely with Smart Dashboards
Real-time dashboards deliver dynamic crack and stress insights from anywhere, enabling faster decisions and proactive infrastructure care.
Remote Crack and Stress Visualization Dashboards
Remote Crack and Stress Visualization Dashboards allow structural integrity data to be viewed, analyzed, and acted upon in real time—from virtually any location. These powerful, cloud-enabled interfaces collect data from sensors and devices installed in critical infrastructure, delivering visual insights into stress, displacement, and crack progression across large or complex assets. Technicians, engineers, and asset managers can review color-coded charts, historical timelines, and threshold-based alerts all from a centralized, mobile-accessible dashboard.
Damage Detection Tech offers highly configurable dashboards tailored for asset-intensive industries across North America. As a growing B2B leader based in Toledo, OH, we specialize in combining cutting-edge technology with intuitive design, helping clients eliminate guesswork and enhance risk management. With built-in analytics, AI-driven trends, and multi-structure integration, our dashboards are designed to simplify monitoring and extend the life of bridges, tunnels, towers, and industrial systems—anytime, from anywhere.
Data Acquisition Layer (Sensors & Inputs)
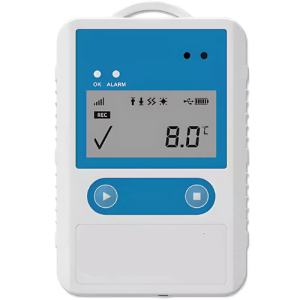
GAO Tek Structural Monitoring Sensors
- GAO Tek Ultrasonic Crack Detectors
Detect surface and sub-surface cracks in steel, concrete, and composite materials. Outputs are used to identify fracture initiation and depth. - GAO Tek Vibration Sensors (RS485/4-20mA Output)
Monitor micro-vibrations and resonance stress in critical infrastructure like bridges, towers, and tunnels. - GAO Tek Strain Gauges & Data Loggers
Continuously capture stress and strain on structural elements. Data is transmitted for live processing and visualization. - GAO Tek Displacement and Distance Sensors
Measure real-time deflection, sagging, and expansion between structural points. Useful in long-span or high-load-bearing assets.
Edge Computing & Communication Hardware
GAO RFID Data Gateways and Edge Controllers
- GAO RFID Industrial IoT Edge Controller
Gathers multi-channel sensor data, performs pre-processing, and transmits clean signals to the dashboard system. - GAO RFID Wireless IoT Gateways (LoRaWAN/Cellular/NB-IoT)
Ensure secure, low-latency data transfer from sensors deployed in the field to the cloud dashboard infrastructure. - GAO RFID Solar-Powered Wireless Modules
Deployed in outdoor or off-grid environments for sustainable operation with uninterrupted monitoring.

Cloud and Dashboard Software Components
GAO RFID Web-Based Monitoring Platform
- Provides centralized access to real-time and historical sensor data
- Dashboards include interactive graphs, color-coded maps, and custom layout views
- Enables device health monitoring, alert configurations, and user-level permissions
Visualization and Alert Tools
- Real-time data plotting of vibration, crack width, strain, and displacement
- Threshold-based alerts via SMS, email, or in-platform pop-ups
- Multi-structure dashboard view (bridge sections, turbines, columns, etc.)
- CSV/PDF/Excel export of inspection and alert data for reporting or audits

System Components
Key Features and Functionalities
- Real-Time Data Visualization : View sensor data from multiple structures on a single interface
- Color-Coded Stress Zones : Instantly assess risk levels with dynamic, intuitive heatmaps
- Historical Data Playback : Scroll through past readings to analyze stress cycles and crack trends over time
- Threshold Alerting : Set custom limits for strain, vibration, or displacement—trigger alerts instantly when exceeded
- Cloud-Based Access : Access from desktop or mobile, enabling remote decision-making for teams in the field
- Multi-Sensor Overlay : Visualize data from crack width gauges, ultrasonic sensors, strain gauges, and more
Compatibility
- Fully compatible with GAO Tek sensors (vibration, ultrasonic, strain, displacement)
- Integrates seamlessly with GAO RFID data loggers, edge controllers, and wireless transmission devices
- Supports LoRaWAN, 4G/LTE, NB-IoT, and Wi-Fi data flows
- Designed for use with GAO RFID’s cloud-based remote monitoring platforms and custom APIs
- Allows integration with SCADA systems, enterprise CMMS tools, or GIS maps via RESTful API
Applications
- Bridge and Overpass Monitoring
- Tunnel and Underground Infrastructure Stress Mapping
- Skyscraper and Foundation Pressure Visualization
- Pipeline Expansion and Crack Progress Tracking
- Industrial Machinery Vibration Dashboards
- Mining and Slope Stability Alerts
- Dam and Levee Wall Integrity Monitoring
Industries Served
- Transportation and Civil Infrastructure
- Oil & Gas and Pipelines
- Renewable Energy and Utilities
- Construction and Engineering Firms
- Mining and Geotechnical Services
- Aerospace and Defense Installations
- Water Management and Dam Operations
- Smart City Planning & Maintenance
Relevant U.S. & Canadian Industry Standards
- ASTM E2209 (Standard for Structural Health Monitoring)
- CSA S6-19 (Canadian Highway Bridge Design Code)
- AASHTO LRFD Bridge Design Specifications
- ISO 13822 (Basis for Design of Structures – Assessment of Existing Structures)
- ANSI/ISA-95 (Enterprise-Control Integration Standard)
Highway Bridge Stress Dashboard in Pennsylvania
Damage Detection Tech installed a network of GAO Tek strain and vibration sensors across a major highway bridge. The dashboard displayed real-time color-coded strain data, allowing DOT engineers to remotely monitor for critical stress points and coordinate maintenance crews within minutes of threshold breaches.
Factory Floor Load Visualization in Texas
A manufacturing facility deployed our dashboards integrated with GAO RFID edge controllers and sensors to monitor stress distribution on key production floor structures. Managers received real-time readings and alerts on mobile devices, helping them prevent overload incidents and reduce downtime by 40%.
Wind Turbine Structural Monitoring in Saskatchewan
Damage Detection Tech implemented GAO RFID-powered dashboards across a 20-turbine site. Strain gauges and ultrasonic sensors tracked blade root and tower base stress, feeding into a cloud platform. Engineers visualized loads in real time and scheduled targeted inspections, reducing manual checks by over 50%.
Ready to visualize your infrastructure's condition in real time?
Contact Damage Detection Tech for a tailored demo, system consultation, or deployment support. Let us help you turn data into smart decisions—anytime, anywhere.